Effective troubleshooting of a motion control system problem can be a daunting and time consuming process, even for seasoned automation professionals. However, the Moog Animatics SmartMotor™ fully integrated servo, with built-in controller and firmware, is constantly monitoring a variety of operating parameters. This case study investigates how that data can be used to quickly and effectively troubleshoot and resolve a motion control system problem.
PROBLEMA customer attached a SmartMotor™ integrated servo to a belt-driven linear actuator using a third party gearbox. The actuator was over a meter in length. When trying to bring the system up, the customer complained the motor was failing to complete its move along the entire length of the actuator. It would move and then randomly stall with both Excessive Position Error Faults and Overcurrent Warnings, see Figure 1. This led the customer to believe that the motor was undersized and not capable of moving the desired load at speed, even though the initial motor sizing calculations used to specify the motor and gearhead stated otherwise.
NOTE: When a motor is undersized, all motion control parameters can be affected. For more details on proper motor sizing, see the System Best Practices Application Note.
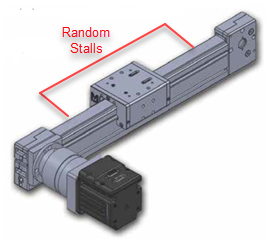
Figure 1: Random stalls area along the actuator length
HOW THE SMARTMOTOR HELPED
The following plan was used to troubleshoot and resolve the problem:
- Confirm the motor sizing.
- Manually test the mating components (gearhead, actuator).
- Reassemble and use SmartMotor Interface tools to isolate the problem.
- Resolve the problem and final test the repaired system.
Each step is detailed below.
- Test motor sizing: Motor sizing was tested by putting it in open loop Torque Mode while observing the power required to move the load along the actuator. Only 30% of the available power was needed to get the load moving at approximately the desired speed. Combined with the initial motor sizing calculations, this proved the motor could produce enough torque to move the actuator.
- Manually test the mating components: The next step was to rule out any inconsistencies in the mechanics of the system. Each mating component, gearbox and actuator, were disassembled and manually driven to feel for any inconsistencies in resistance. Due to the 40:1 gearbox reduction, driving the gearhead by hand was impractical, so the motor was reattached and the motion profile was executed. No inconsistencies or errors were observed.
- Use SmartMotor™ interface tools to isolate the problem: The system was reassembled and, using the Chart View tool in SMI, plots of real time data were produced. The graphs provided helpful clues needed to locate the source of the problem, see Figures 2 – 4.
a. A velocity plot showed disturbances that occurred several times in each move.
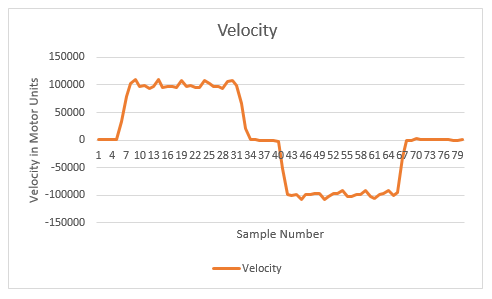
Figure 2: Velocity Over Time While Carriage Travels Length of Actuator
b. A plot of the current draw was added, showing the current draw spikes occurred at the same points as the velocity disturbances. The SmartMotor integrated servo compensated for the increased load by pulling additional current to maintain the target velocity.
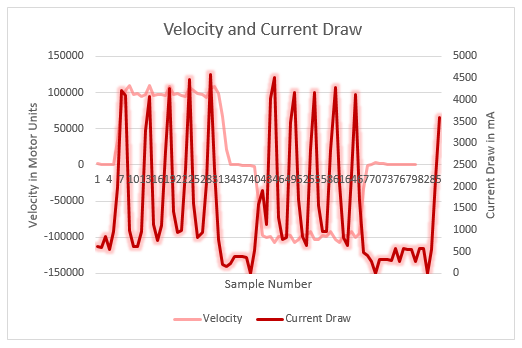
Figure 3: Current Draw with Velocity Overlaid
The cyclic nature suggested that the increased loading was caused by a rotating component. The frequency further identified where the problem area might be:
- An issue between motor and gearhead would show disturbances occurring once per rev or every 4000 counts.
- An issue between gearhead and actuator would show disturbances occurring at a rate that matches the gear reduction.
c. A rollover counter was created that occurred every 160,000 motor counts (once per gearhead revolution) and the plot was added. This revealed that a disturbance occurred at each rotation of the gearhead shaft.
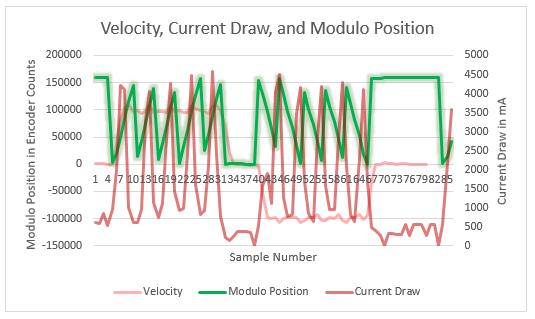
Figure 4: Current Draw, Velocity, and Position Data Over Time
- Resolve the problem and final test: The customer removed some covers to reveal a cavity where the gearhead and actuator were mated, see Figure 5. Metal shavings were found, indicating there was mechanical misalignment causing interference. Further analysis uncovered eccentricities in the rotating hardware. The actuator manufacturer was notified and supplied the customer with new hardware that resolved the issue.
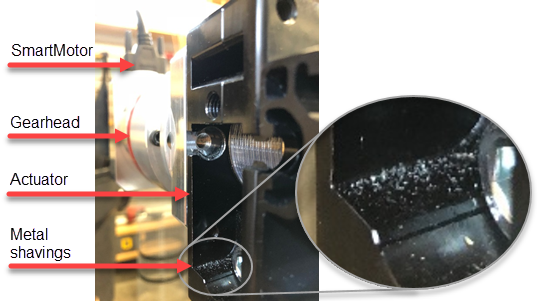
Figure 5: Metal Shavings in Actuator Cavity
BENEFITS
As shown, the SmartMotor™ was used to quickly and effectively solve the performance problem in the actuator system. Its integrated data collection capabilities along with the data plotting tools in the free SMI software allowed the customer to diagnose the mechanical problem in the actuator assembly. This was accomplished without need for investing in other diagnostic equipment – simplifying the process and saving the customer both time and money.
Also, note that only a few SmartMotor™ data parameters were needed in this application. However, many more are available to meet the needs of a wide variety of applications across many different industries. Our other case studies illustrate the many different ways the SmartMotor™ integrated servo has come to the aid of applications in aerospace, general industry, medical equipment, pharmaceutical, metalwork, semiconductor and more.
Further, Moog Animatics is constantly working to improve the SmartMotor™ firmware and SMI software by incorporating cutting-edge features and technology, along with ease of use. Our mission is to save you time and money in all phases of the process from system design and prototype through machine build and replication, and even system diagnostics and maintenance.
Contact Moog Animatics or your sales rep today to find out how the fully integrated SmartMotor servos and software can immediately solve your most challenging motion control problems.
Download the PDF version of this case study here.
[1] Charts shown were reconstructed for presentation in this document.
